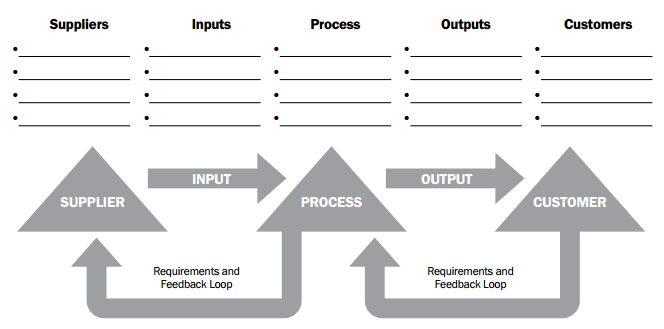
SPIOC model is flowchart tool to perform quality management. Here is an example of how a project manager uses a SIPOC diagram for a simple process, such as “Improve quality of estimates”. The diagram can be created rather quickly by drawing a chart with five columns. Each column is labeled, from left to right, with the letters SIPOC or the words suppliers, inputs, processes, outputs and customers.
In SIPOC charts you start from the center column, process. The process column is kept simple; ideally it lists each step consists of an action and a subject (verb/noun).
| Improve quality of estimates | ||||
| Supplier | Input | Process | Output | Customer |
| Person who going to work on the task | Scope | Invite Supplier | Cost Estimates | Project Manager |
| Consultants | OPA (Organization Process Assets) | Provide Input | Schedule Estimates | Project Team |
| SMEs | EEF (Enterprise Environmental factor) | Perform Brainstorming | Resource estimates | |
| Risk Register | Perform Delphi techniques | |||
| Stakeholder register | Nominal group techniques | |||